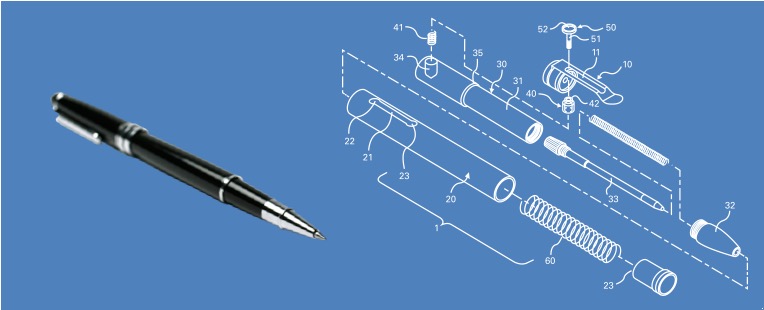
The traditional approach is to capture a design in detailed documents and figures. For example, to specify an object to be made on a milling machine, a designer might use multiple orthogonal views of the object. This is effective for annotating and dimensioning, but it can be difficult to mentally integrate these views into a visualization of the object.

Figure 1: A User's Visualization versus a Designer's Visualization
Designers can also visualize an object by using an interactive design environment. It’s much more productive to directly edit a 3D model when designing an object. The visualization is not restricted to discrete projections, and designers can easily see how an edit in the 3D model affects various projections.
Visualization is a crucial part of design in general, but visualizing the design of systems that bridge the cyber and physical worlds (also known as cyber-physical systems) poses a particular challenge because of the critical roles that software and communications play. The design of the physical system may be straightforward, but the cyber part requires specialized tools for visualizing software design. Visualizing software design is very challenging because of its abstract nature, unbounded flexibility, and sheer complexity. A significant part of the design of cyber-physical systems is in the software. As a result, improving software design and development productivity can make the biggest impact on a project.
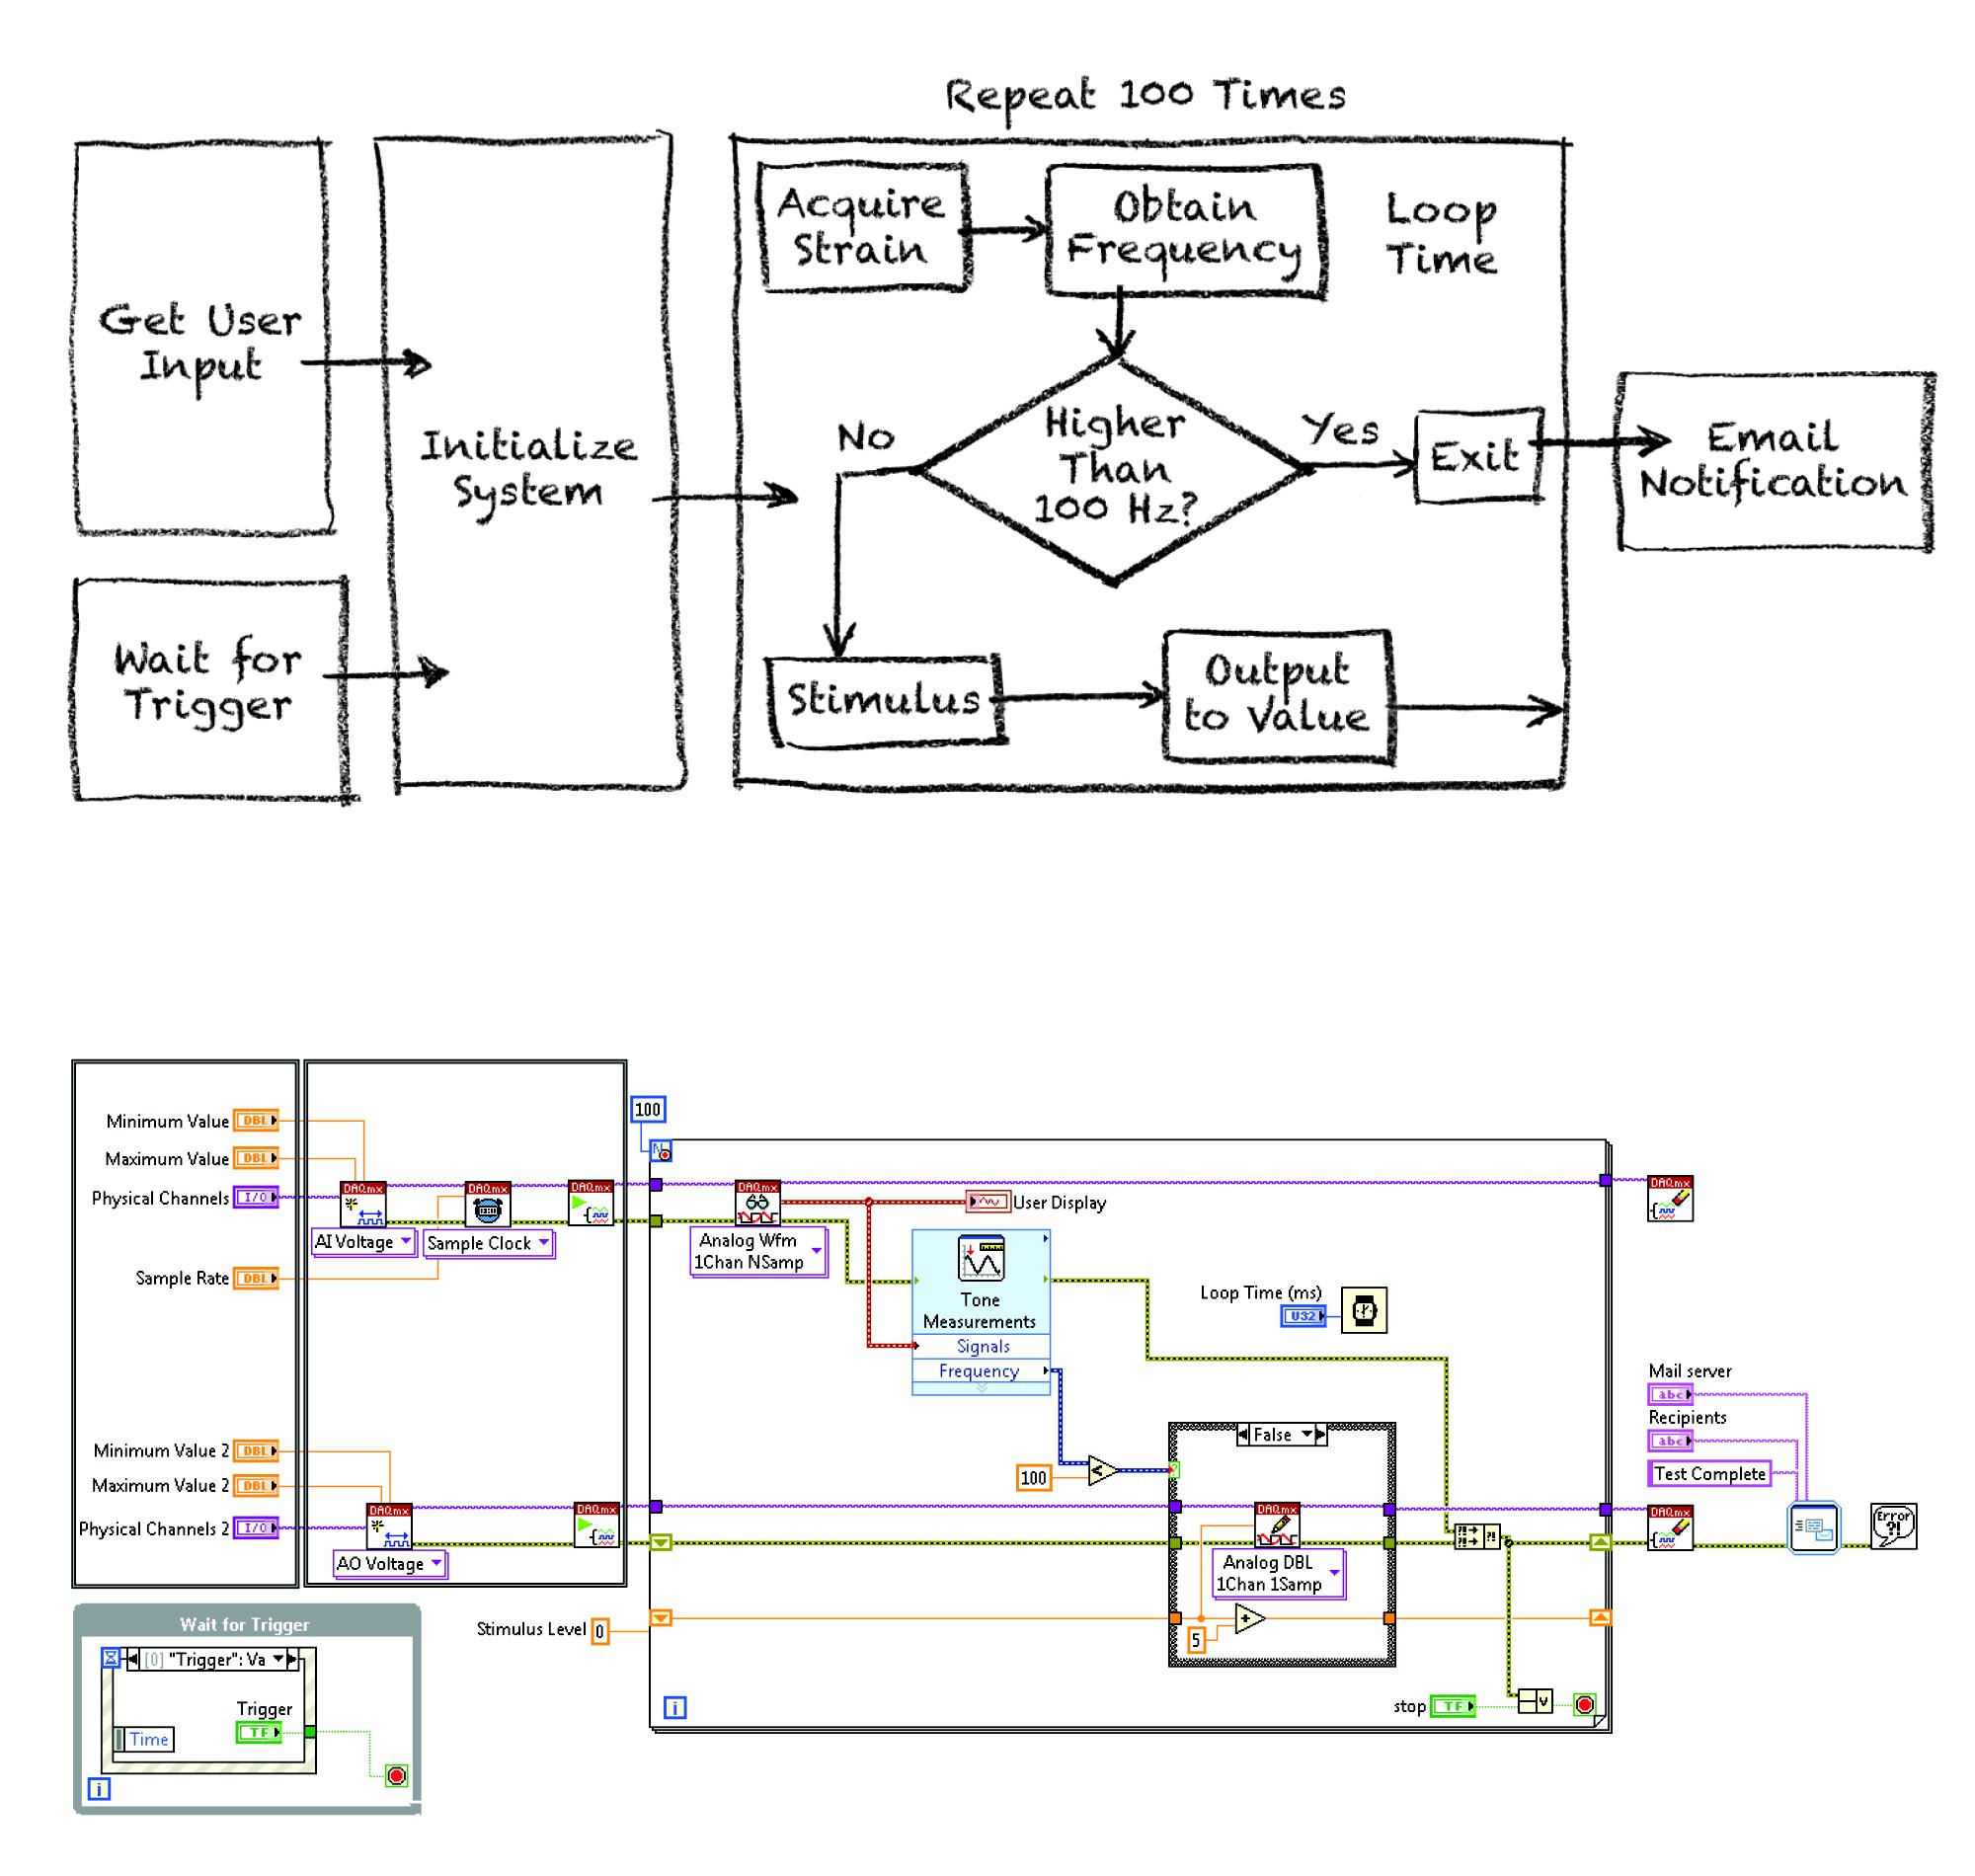
That’s the reason we invented LabVIEW. LabVIEW is an environment for creating and editing the visualization of a software design. It uses graphical dataflow diagrams and interactive front panels to create a hierarchy of modular software-defined instruments. LabVIEW is highly productive because the visualization of the design is also the implementation.

Figure 2: Graphical dataflow diagrams serve as both design visualization and implementation.
LabVIEW source code consists of graphical dataflow diagrams that clearly show data dependency relationships. A wire shows the source of a data value and the destinations that use it. There is no possibility for unseen access or modifications to the value on a wire before it arrives at the destinations. Loops and other control structures are boxes on the diagram, clearly separating the inside from the outside. There is no way a syntax error can inadvertently move the boundary of a loop.
With LabVIEW, the visualization is the implementation. This makes it an excellent tool for rapid prototyping and incremental development. The ease with which designers can change visualizations means they can more effectively explore their applications’ design spaces, which results in more optimal solutions and shorter times to market. The by-value semantics of dataflow ensure the safety and scalability of designs. Hierarchical composition is uniform at all levels, and so is the execution behavior. The per-module front panels facilitate debugging, unit testing, and user interaction at all levels of a design. All of these attributes and more contribute to the productivity of using LabVIEW.
One of the most important attributes separating LabVIEW from other software tools is that dataflow is inherently parallel. Traditional programming languages are sequential languages, modeled on the way computers work as Von Neumann machines. Sequential languages are simply not suitable for parallel machines. This is a major stumbling block as industry moves to multicore machines and FPGAs. As far back as 1977, John Backus pointed out the limitations of the Von Neumann architecture, not only as a data bottleneck but also as an intellectual bottleneck. Thirty-five years later, traditional text-based sequential languages continue to perpetuate this intellectual bottleneck.
The LabVIEW dataflow language transcends this, which makes it ideally suited to meet the design challenges that cyber-physical systems, and ultimately the Internet of Things, pose today. This graphical approach is still evolving with many active research areas focusing on software visualization and the underlying hardware capabilities.
One ongoing area of research is timing. Most software applications are optimized for overall performance rather than accurate timing. Cyber-physical systems, however, critically depend on accurate timing. LabVIEW can visually represent required timing using a Timed Loop and produce real-time execution performance. Though designers can visualize the run-time execution in detail using the Real-Time Trace Viewer, they don’t have a way to anticipate detailed timing performance up front as part of the design process.
Since it is necessary to specify only the precise timing of sensors and actuators, the compiler should schedule the other software to fit the I/O. Innovations in representation can make it easier to specify precise I/O timing without overly constraining the timing of the rest of the software. It is possible to build precisely timed distributed cyber-physical systems today, but it will be considerably simpler in the future with a more explicit software representation of time, along with hardware enhancements for isochronous communication.
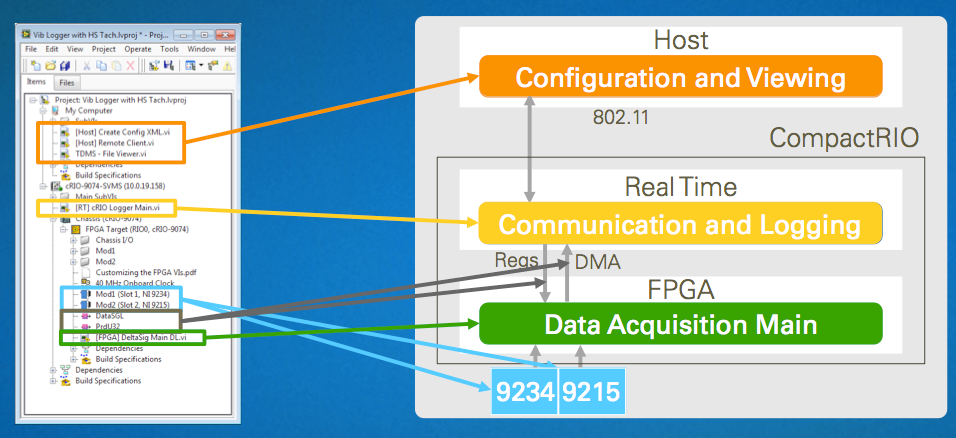
Another area of research concerns the configuration of hardware resources and deployed software. LabVIEW currently shows this information organized in a tree through the project window. Since a tree can’t show the connections between components, designers have to use their imaginations to visualize them. The LabVIEW project window needs a diagrammatic representation to show the configuration of hardware components, interconnections, sensors, and actuators as well as potentially a representation of the physical machine. It will be possible to smoothly morph from a photo-realistic physical visualization of the system to logical visualizations at multiple levels of abstraction. The logical representation can show the software deployed on each programmable component.

Figure 3: A project tree doesn't help designers visualize the connections between components.
Timing and configuration are just two of many research areas we are actively pursuing to extend the capabilities of our platform. Whiteboard use is one indicator that helps me gauge how much is left to do. If I have to draw on a whiteboard to explain my design, then I know there’s more opportunity to capture that with better tools.
Platform-based system design produces flexible and scalable systems with higher productivity and lower total cost than traditional methods. And the continuing evolution of a graphical approach means even more performance and productivity gains are to come.


