We describe the assembly of a 4-LED bargraph indicator (but that can be expanded with the use of more integrated), which can be used in several applications such as:
A) Component testers or continuity meters.
B) Temperature or light intensity meters.
C) Voltage or battery condition monitors.
D) Signal level indicators (audio or RF) such as VU-meter, for example.
In the exemplified version we use 4 LEDs, but if two integrated devices are used we can have a scale of 8 LEDs. The definition or "window" of the drive will depend on the values of the components used, and the precision is given by the hysteresis of the 4093.
The important thing of the project is that the high input impedance of the integrated circuit 4093 allows the use of resistors of very high values In the reference divider, and thus a very high input impedance for the indicating circuit.
The values suggested in the text are for normal use, and the reader can make changes in a wide range according to the desired final characteristics. We note that the input voltage must never exceed the supply voltage used for the circuit.
HOW IT WORKS
The 4093 integrated circuit consists of 4 NAND 2-input ports that can be used as inverters. When the input voltage of one of the ports (connected as an inverter) reaches the trigger threshold, the output goes low and can drain a current of a few milliamps.
This threshold voltage will be in an intermediate value between the supply voltage and zero volts. However, as shown in Figure 1, the 4093 has a hysteresis, which means that even if the voltage drops shortly after firing, the circuit returns does not return to its initial condition.
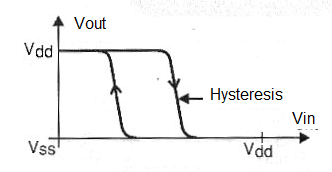
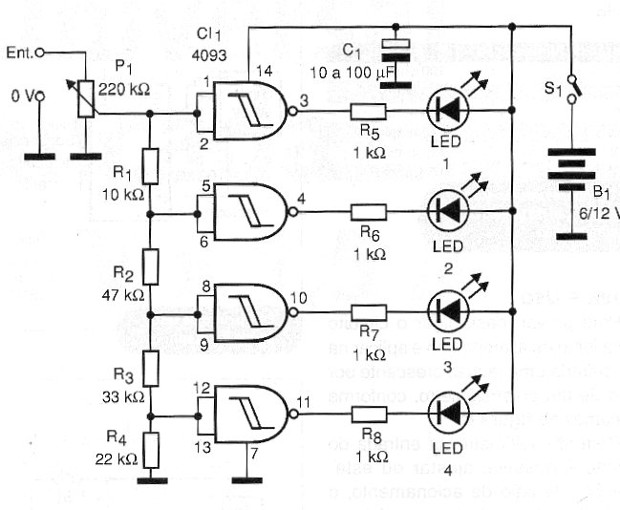
In our project, we are connecting a series resistor network at the inputs of the four 4093 ports. In this way, each of the integrated circuits will trip with a voltage slightly higher than the previous one, forming a stepped drive system.
The first LED therefore lights up with the lowest voltage, the second with a slightly higher voltage, until the last one that lights up with the highest input voltage. Since turning on an LED does not imply that the previous LED goes out, the system functions as a movable bar indicator. In this system, for the highest input voltage all LEDs will be on.
The values of the network resistors will determine the trigger point of each LED. In our case, we have included a scale adjustment that is a trimpot at the end of the network. This component may eventually be replaced by a fixed resistor. An important point to note is that we should not apply a voltage higher than that used in the supply to the circuit.
ASSEMBLY
In figure 2 we have the complete diagram of the bargraph indicator.
For simple application we can mount the circuit on a printed circuit board with the arrangement of components shown in figure 3.
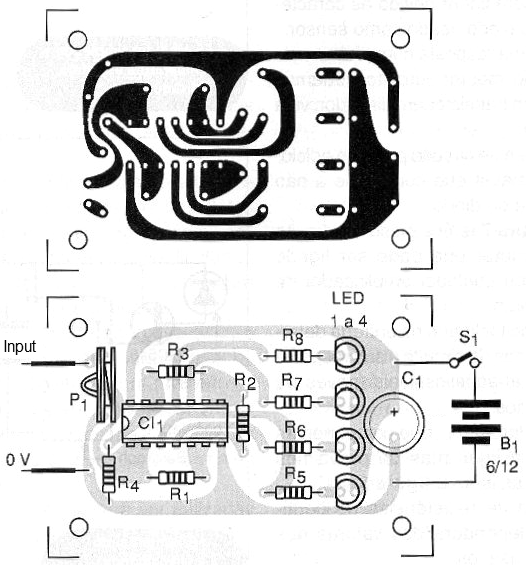
The LEDs can be all red or of any color, with formats that depend on the application. The use of rectangular LEDs makes the assembly visually more interesting. In the assembly it is important to observe the polarity of the LEDs and that they are all of the same brightness.
It is common for a lot of LEDs to find quite large differences between the brightness of the units. The value of the resistors in series with these LEDs can be changed to compensate for differences in brightness. However, on average the brightness will depend on the supply voltage being suggested the values ??of the following table:
| Supply Voltage | R5, R6, R7, R8 | 3 V | 100 ohm | 5 V | 330 ohm | 6 V | 470 ohm | 9 V | 680 ohm | 12 V | 1 k ohm | 15 V | 1.5 k ohm |
TEST AND USE
To prove, simply connect the circuit to a power supply and apply an increasing voltage through a potentiometer at its input, as shown in figure 4.
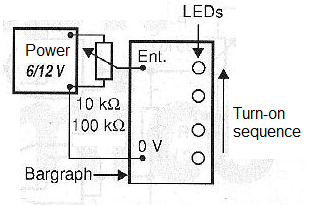
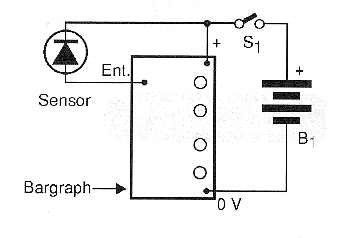
With a voltmeter at the input of the circuit it is possible to adjust or set the drive voltage, and eventually recalculate the resistors from R2 to R4 that determine the trigger points of each LED. In Figure 5 we have an application of the circuit as a temperature gauge using a common diode as a sensor.
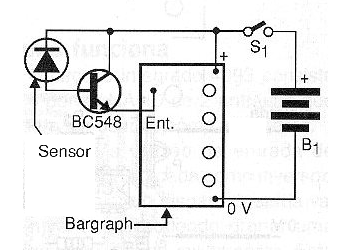
For a response in a narrower range of the same circuit we can add an amplifier transistor, as shown in figure 6.
In figure 7 we have the use of the circuit in a VU meter that can be connected to the output of any common audio amplifier.
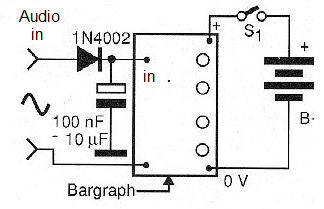
The capacitor connected to the input determines the inertia of the circuit and its response to variations to more bass or treble sounds. For a component tester, simply connect the test leads to the points indicated in figure 8.
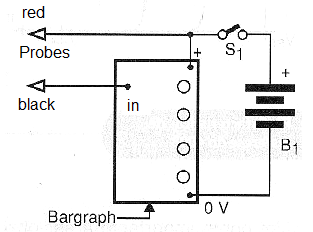
The range of continuity resistors will depend on the values of the resistors used. Other applications for the circuit are provided by each assembler.
Semiconductors:
CI1 - 4093 - CMOS integrated circuit
LED1 to LED4 - Common red LEDs
Resistors: (1 / 8W, 5%)
R1 - 10 k ohm - brown, black, orange
R2 - 47 k ohm - yellow, violet, orange
R3 - 33 k ohm - orange, orange, orange
R4 - 22 k ohm - red, red, orange
R5, R6, R7, R8 - 1k ohm - brown, black, red
P1 - 220 k ohm - trimpot
Capacitors:
C1 - 10 to 100 uF - electrolytic
Miscellaneous:
S1 - Single switch (optional)
B1 - 6 to 12 V - battery or power supply
Printed circuit board, wires, solder, etc.


