This circuit drives ten LEDs in response to an analog voltage applied to its input and can be used to provide a visual indication of the instantaneous power being developed by an audio amplifier.
It can also be used to provide visual indication of variable events in science experiments.
You can extend the project by using two chips and you’ll be able to continuously monitor the audio output power of both channels of your stereo system.
The circuit can be used with amplifiers ranging from 0.1 to 100 watts.
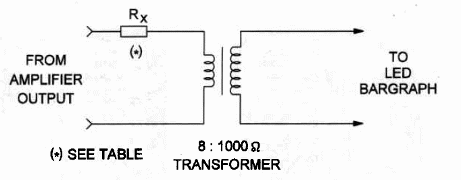
In some cases you should use a small transformer, wired as in Figure 1, to isolate the input and match impedances.

This is necessary when the amplifier has a low-output impedance. Resistor Rx is chosen according to the output power of the amplifier. Values are given in Table 1.
Table 1

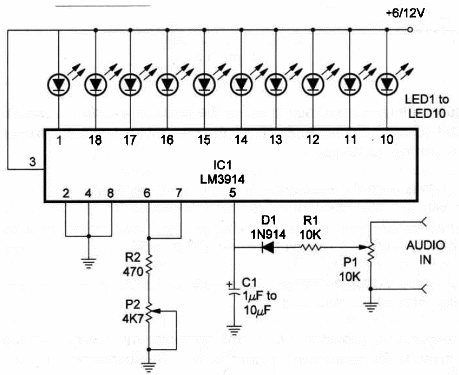
A schematic diagram of the LED bargraph is shown in Figure 2.

The circuit uses an LM3914 IC to drive the LEDs, converting voltages into one often outputs.
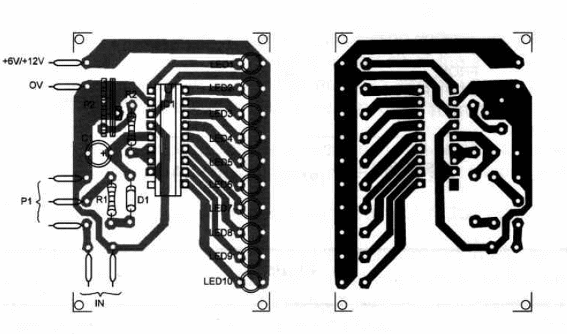
The components are placed on a printed-circuit board as shown in Figure 3.

If you’d like to build your circuit the same way, you can etch your own board using the solder and component-side templates shown in this figure.
P2 adjusts the dynamic range in which the circuit operates. P1 adjusts sensitivity and depends on the application.
You can set the value to a fixed point by using a trimmer potentiometer.
Audio comes from the loudspeaker output of the amplifier.
Any small transformer with a high-impedance coil and a low-impedance coil can be used.
Any small transformer with a 117 VAC primary, secondary rated from 5 to 12.6 volts, and current ratings between 100 and 500 mA can be used.
Position of the polarized components, such as LEDs, diode, and electrolytic capacitor, should be observed.
Bass response is provided by C1. You can alter this component within the range given in the schematic diagram to achieve best performance.
Remember that the highest applied voltage to the input shouldn’t exceed the power supply voltage.
LED Bargraph
IC1 - LM3914 Integrated circuit (National)
LEDs - Common red, yellow or green
D1 - 1N914 or 1N4148 general purpose silicon diode
R1 - 10,000 ohm, ¼ W, 5% resistor
R2 - 470 ohm, ¼ W, 5% resistor
P1 - 10,000 ohm potentiometer
P2 - 4,700 ohm trimmer potentiometer
C1 - 1 to 10 µF, 12 WVDC electrolytic capacitor - see text
Ideas to Explore
To learn more about the circuit or to get better performance:
Determine the voltage level that turns on each LED using a DC power supply plugged to the input of the device.
By wiring probes at the positive power supply line and the input you can use this circuit as a digital resistance or conductance meter.
Science projects:
This circuit can replace the common multimeter to indicate voltage variations in experiments. The visual effect is better.
It can also be used in the output of a lie detector or bio-feedback.
Conect an LDR between the input and (+) for a digital photometer. For a digital thermometer wire an NTC between (+) and the input.
This circuit can also replace the LED and resistor in the Continuity Tester and the same experiments, with advantages, can be performed.


