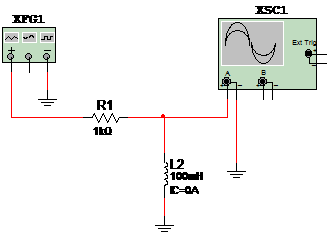
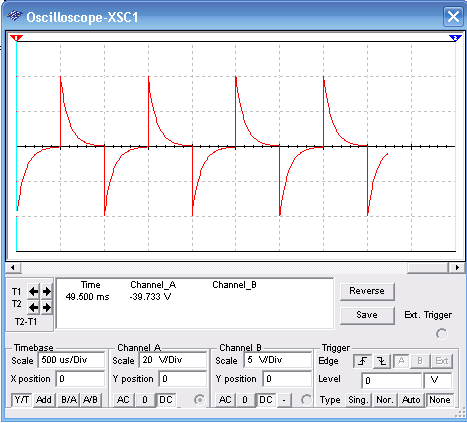
The arranjment sohon Bellow, and simulated in the Multisim Blue allows to see in the oscloscope the response of na inductor to a square signal. The function generator must be adjusted to source a 1 kHz square signal with amplitudes in the range between 3 and 10 V. See the sensivity and time adjustments for the oscilloscope. This values can changing according the value of the inductor in test. Lower inductances mean hight frequencies in the test.


Starting from the formula T = 0.632 x R x C you can calculate the value of the inductor, taking as reference the point where the signal amplitude is 37.7% of the peak.
To download the simulation files and Netlist - click here (msb0005e.zip)


